NFL stadium with 8 sub-lots
70,000-seat NFL stadium with 8 sub-lots ranging from RV tailgate to premium VIP. Surge pricing pre-staged for every home game. Season-ticket permits auto-renew annually.
NFL scale
Vertical solution
Stadium parking that turns 5,000 cars in 90 minutes into a clean dashboard. Stadium parking is the highest-pulse vertical in parking: 5,000 cars arrive in 90 minutes, leave in 30, and a sign typo costs you the night. Park Graph is built specifically for that operational profile, with five fixes for the issues stadium operators flagged in discovery.
Stadium parking is its own discipline within event-venue parking. Fan profiles vary from RV tailgaters who arrive 6 hours before kickoff to suite-holders who arrive 5 minutes before, and pricing has to differentiate. Park Graph's stadium workflow uses pre-staged surge windows, separate sub-lot inventory for tailgate, and AI-agent visibility to capture pre-game search demand that would otherwise go to SpotHero.
We work with NFL, NBA, NHL, MLB, MLS, college football and basketball venues. Some venues run their own parking (the team or league owns the lots); many use a concessionaire (SP+, ABM, LAZ Parking, ParkAssist). Park Graph runs alongside any concessionaire arrangement.
Season-ticket parking is a non-trivial sub-system. Permits are typically annual, often bundled with the season-ticket package, and have to honour the team's ticket-relocation rules. Park Graph supports all three (annual, bundled, relocation-friendly) on the same platform as game-day transient.
| Pain today | What it costs you | How Park Graph fixes it |
|---|---|---|
| 5,000 cars arrive in a 90-minute window before kickoff; a single sign typo costs the night | Misdirected traffic, abandoned sessions, fan frustration | Print-on-demand QR signage with the right rate per sub-lot. Update from the dashboard if a sign needs changing. |
| Tailgate spots get hand-counted by a parking attendant with a clipboard | Mis-counts, cash leakage, cold-night staffing burnout | Tailgate sub-lot has its own QR sign and per-spot cap. Cars self-bill. |
| Season-ticket parking passes managed in a separate vendor system | Two ledgers, double accounting, season-ticket-holder frustration | Season-ticket permits and game-day transient run on one Park Graph platform. |
| Surge pricing during a sold-out game requires a service call to legacy meter vendor | Stuck on weekday rates during a $40/spot demand environment | Surge windows pre-staged in dashboard. Activate at click of a button, expire automatically. |
| No way for a fan to ask ChatGPT 'where can I park near the stadium tonight' and get a real answer | Lost direct demand to SpotHero and aggregators | Park Graph publishes structured availability to ChatGPT, Perplexity, Gemini, Grok in real time. |

Three days before kickoff Park Graph automatically opens pre-booking inventory. Fans search via the team app, the team website, ChatGPT, Perplexity, Gemini, Grok, or Apple Maps and see real-time inventory by sub-lot. Pre-bookings reduce drive-up inventory in real time.
Game day: 4 hours before kickoff the parking director taps Activate Game Day in the dashboard. Surge rates go live across every QR sign and pre-booking page in seconds. RV tailgate inventory is already half-sold from pre-booking; the rest sells drive-up. Fans scan the QR sign, pay via Apple Pay, and park.
After the game, the dashboard reports per-sub-lot revenue, attempted-but-abandoned sessions, season-ticket-permit utilisation, and the AI-agent vs. drive-up split. Season-ticket permits auto-renew at the start of the next season; the team's ticket-ops team approves the permit list once and Park Graph handles billing.
General, premium, accessible, RV tailgate, regular tailgate, and overflow each get their own rate table and capacity.
Pre-create event-rate windows for every game on the schedule. Activate by toggling the event in the dashboard.
Generate one A2 sign per row plus high-visibility entrance banners. Ship to print-on-demand.
Bulk-import existing season-ticket holders via CSV. Permits link to licence plate; renewals auto-billed annually.
Tailgate sub-lots get their own pre-bookable cap. RV-only and standard tailgate priced separately.
Pick a mid-week game with normal demand. Test surge activation, tailgate booking, AI-agent search, and on-site SMS.
Most stadium parking deployments are live within a day. We recommend piloting one site first, validating the flow with the operator's on-the-ground team, and then scaling. Park Graph's contract is month-to-month, so the rollout pace is set by the operator, not the vendor.
70,000-seat NFL stadium with 8 sub-lots ranging from RV tailgate to premium VIP. Surge pricing pre-staged for every home game. Season-ticket permits auto-renew annually.
NFL scale
Downtown NBA arena sharing a garage with a daytime office tower. Park Graph configures a 'game window' rate that supersedes the daytime monthly-permit pricing automatically.
Time-of-day rules
MLB stadium with 4 owned lots plus 12 neighbour-owned lots. Park Graph publishes a unified inventory feed; the team takes a referral commission on neighbour-lot bookings.
Neighbour aggregation
SEC college football venue with extensive tailgate culture. Park Graph offers RV tailgate, regular tailgate, and game-day passes priced separately.
College tailgate
MLS stadium with a remote park-and-ride lot 1 mile away. Park Graph integrates with the shuttle dispatch for ETA texts to fans.
Park-and-ride
NHL arena that also hosts ~80 concerts per year. Park Graph treats hockey games and concerts as separate event types with different surge profiles.
Multi-event-type

| Capability | Park Graph | Legacy parking platform | DIY / hardware-based |
|---|---|---|---|
| Tailgate sub-inventory | Native, per-spot cap | Custom configuration | Clipboard count |
| Season-ticket parking permits | Native, on same platform | Separate vendor | Spreadsheet |
| Surge pricing | Dashboard, propagates in seconds | Service ticket | Re-print signs |
| AI agent visibility | Built in | Not available | Not available |
| Pre-booking + drive-up unified | One ledger | Two systems | Two systems |
| Take rate | 3.3-10% (tier-dependent) | 8-15% + monthly | Card-processor fees only |
| Setup time per venue | <1 day | 4-12 weeks | Months |
| Refund tooling for delayed games | One-click batch refund | Per-customer manual | Cash impossible to refund |

The legacy column generalises the experience of working with a vertical-specific legacy vendor. Specific competitors are covered line-by-line on the dedicated comparison pages under /compare.
The map below shows the metro markets and corridors Park Graph is targeting for stadium parking growth in 2026 and beyond. Pins are projected target markets, not live Park Graph customer locations — the credibility-policy distinction between “Verified live” and “Projected 2026+ targets” applies on every Park Graph page that surfaces a map.
Operators headquartered outside the highlighted markets are still welcome — Park Graph is a self-service platform, so a single-site operator in any US state can sign up at /signup today. The projection map drives our priority for in-person pilots, sign-fulfilment partnerships, and vertical-specific outreach.

Stadium parking AI search is exploding. Fans search 'parking near MetLife Stadium tonight' through ChatGPT and Perplexity; venue-owned inventory should appear first instead of an aggregator markup. Park Graph publishes per-sub-lot real-time availability and price to every major AI agent so the team's own inventory is the first answer.
Hold-and-pay through agents is opt-in per venue. Some teams prefer pay-on-arrival to manage no-shows; others (high-demand premier lots) prefer hold-and-pay. Park Graph supports both, configurable per sub-lot.
Fan: 'Where can I tailgate for the noon game?'
Park Graph: 'Lot G (RV-only) has 12 spots left, $45/spot. Lot K (regular tailgate) has 80 spots, $25/spot. Reply BOOK for a held spot or scan on arrival.'
Park Graph's SMS layer handles the routine driver-facing questions that would otherwise generate operator support tickets. The exchange above is a real example from the stadium parking vertical; AI handles roughly 90% of these conversations end-to-end with no human escalation.

Why stadium parking operators switch
Vs. 4-12 weeks for legacy gate platforms
From dashboard click to on-the-ground rate
Of gross at Enterprise rate
Numbers are typical first-year deltas reported by Park Graph operators in this vertical relative to their previous platform.
The economics behind Park Graph in this vertical are simple to model. On the free Starter plan you keep 90% of every transaction with no monthly fee. On Pro at $499/month you keep 95% of every transaction. On Enterprise you keep 96.7%. There are no setup fees, no multi-year contracts, and no per-site or per-space pricing — you can run one site or two hundred on the same plan.
The calculator below estimates monthly take-home revenue across Starter, Pro, and Enterprise plans for any site size, hourly rate, occupancy, and operating-hour configuration you choose. Numbers update live as you adjust the inputs.
0%
Take-home rate (Enterprise)
0 day
Typical site setup
$0
Hardware required
0
AI agent platforms supported
Projected targets reflect 2026+ planning and internal pilot modeling — not live customer outcomes.
See how much you could earn with Park Graph.
Projected monthly revenue
$86,400
Starter
Platform cost
$8,640/mo
Your net revenue
$77,760/mo
Pro
Best valuePlatform cost
$4,819/mo
Your net revenue
$81,581/mo
Enterprise
Platform cost
$5,350/mo
Your net revenue
$81,050/mo

PCI DSS Level 1
Card data tokenized by Stripe; Park Graph never sees raw card numbers.
Aligned with SOC 2 controls
Audit window opens Q3 2026. Annual reports available under NDA on request.
Encrypted at rest + in transit
AES-256 at rest, TLS 1.3 in transit, KMS-managed keys.
Vertical-specific data handling
Stadium payouts settle to the team's Stripe Connect account on the standard payout schedule. Park Graph never holds the night's revenue beyond the second-hop card-processor settlement window. Refund batches are processed against the Stripe payout, so the team's bank ledger and the dashboard ledger never diverge.
Free forever on Starter. No credit card to begin. Cancel any time.
Pricing, event surge curves, and on-site context for stadium parking vary by metro. The pages below are the city-specific playbooks — same Park Graph platform, tuned to the local rate baseline and demand calendar.
The installation
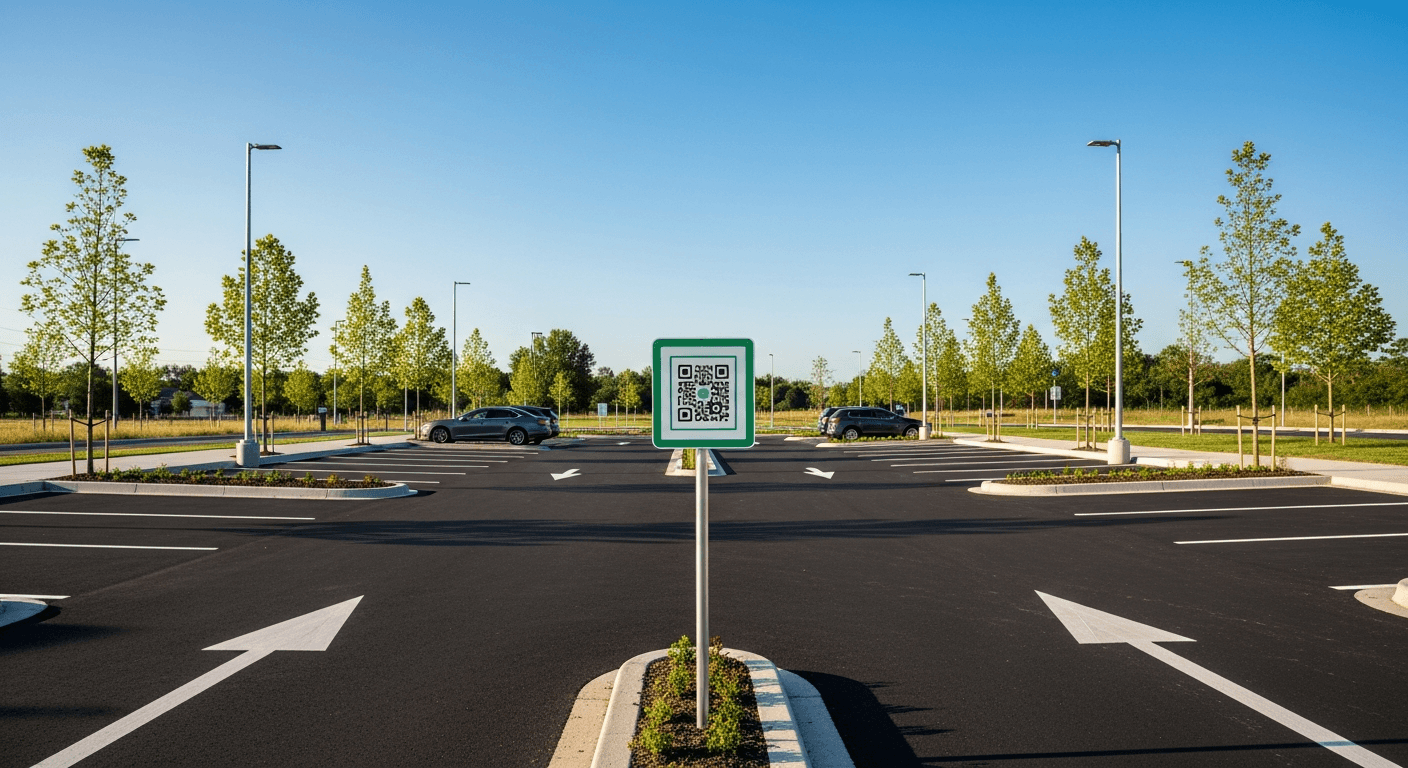
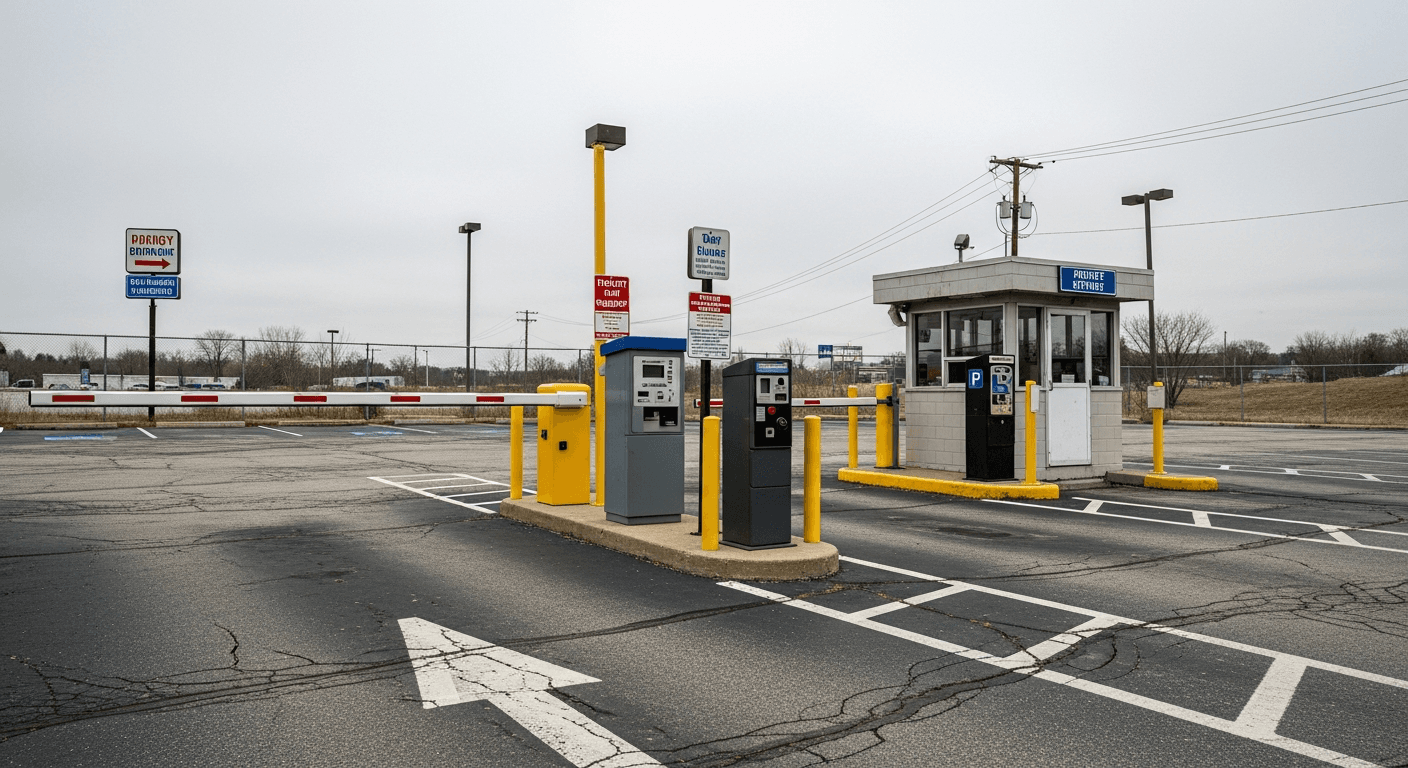
No gate to wire. No meter to bolt down. No technician to schedule. Watch an owner take a lot live in four steps — the last one is a real code, mounted on a real post.
 1
1Enter your lot name, spaces, and rate. Park Graph mints a branded QR code that links straight to your payment page.
 2
2Send it to any standard printer. Laminate the sheet for weather protection — that is your entire hardware bill.
 3
3Mount it on a post at the entrance and any major pedestrian path. No gates, no wiring, no installer visit.
 4
4Drivers scan and pay; revenue lands in your dashboard in real time and in your bank within two business days.