Downtown commercial district
Replace 60 pay-and-display kiosks with QR signage on every block. Pilot 2 zones first, scale to all 12. Enforcement officers issue citations from their issued iPhones.
Pay-by-plate
Vertical solution
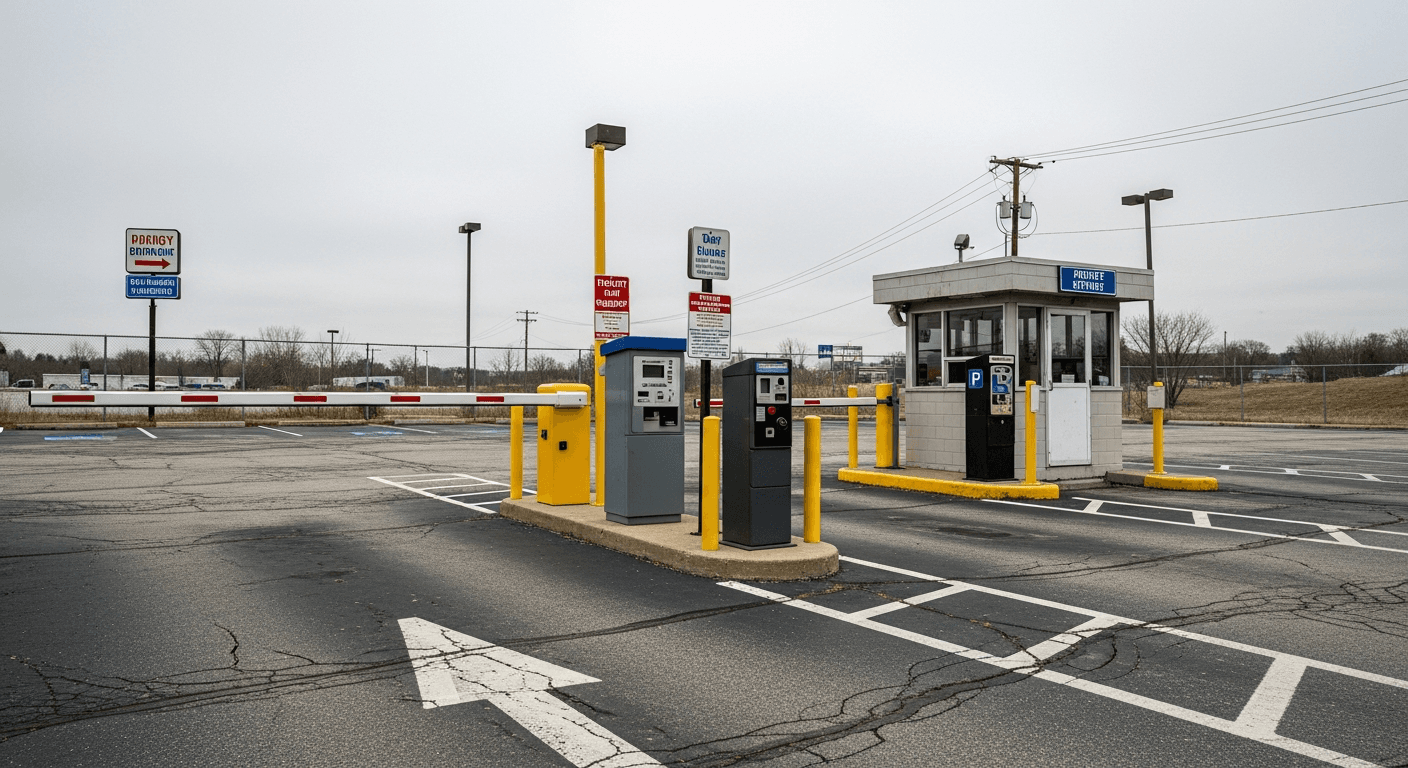
Municipal parking, without the vendor lock-in or the kiosk service contract. Cities have run on the same kiosk vendors for two decades. The kiosk model fails for predictable reasons: it's expensive, breaks in winter, attracts vandals, and forces residents to download yet another app. Park Graph replaces the kiosk with a printed sign and gives the enforcement officer a phone instead of a handheld terminal.
Municipal parking is regulated, audited, and politically visible in a way no other vertical is. The parking director answers to the city council; the council answers to residents who want both convenient parking and fewer complaints; and federal ADA compliance, state procurement law, and local privacy ordinances all sit on top.
Park Graph is built specifically for that environment. Procurement-friendly contracts (no per-zone fees, no minimum kiosk count). FedRAMP-aligned hosting roadmap. Open APIs so the city can audit every transaction without a vendor's permission. ADA-compliant signage by default. Open data feeds so transparency portals don't require a custom export.
We work with cities ranging from a 4,500-population beach town to a 1.2M-population state capital. The architecture scales linearly because there is no per-kiosk cost driver.
| Pain today | What it costs you | How Park Graph fixes it |
|---|---|---|
| Pay-and-display kiosks fail in winter and after vandalism | $8k-$25k per kiosk replacement, weeks of lot offline | QR signs cost $5 to replace. Printed locally, posted on existing poles. |
| Residents refuse to download yet another parking app | Adoption stalls, council complaints | QR scan launches mobile browser. No app, no account creation. |
| Enforcement officers carry a $1,200 vendor-locked terminal | Hardware refresh every 3 years, vendor licence per device | Officers run Park Graph Enforcement on any iPhone or Android. |
| Permit programs run in a separate system from transient parking | Two ledgers, two reconciliation flows | Permits and transient sessions live in one billing pipeline. |
| ADA-compliant signage requirements not met by some kiosk vendors | Federal compliance risk | Park Graph QR signs ship with full ADA contrast, font, and braille options. |

A driver pulls into a downtown commercial zone. They scan the QR sign on the parking-meter pole with their phone. The Park Graph payment page loads with the city's logo, the zone ID, the current hourly rate, and the maximum stay. They pick a duration, tap Apple Pay, and the session is active.
An enforcement officer walks the block. They open Park Graph Enforcement on their issued iPhone, scan the licence plate (camera-based ANPR, no extra hardware), and the app shows whether the plate has an active session and how much time is left. Expired plates auto-flag for citation; the officer reviews and issues with a single tap. Citations write to whichever court-clerk system the city already uses.
Residential permit holders run on the same backend. The permit lives on the licence plate (or a registered virtual permit). The enforcement officer's app shows the permit status when they scan; no separate permit lookup, no separate vendor.
Each on-street zone gets its own ID, time-of-day rate, and enforcement window. Most cities pilot 2-3 zones first.
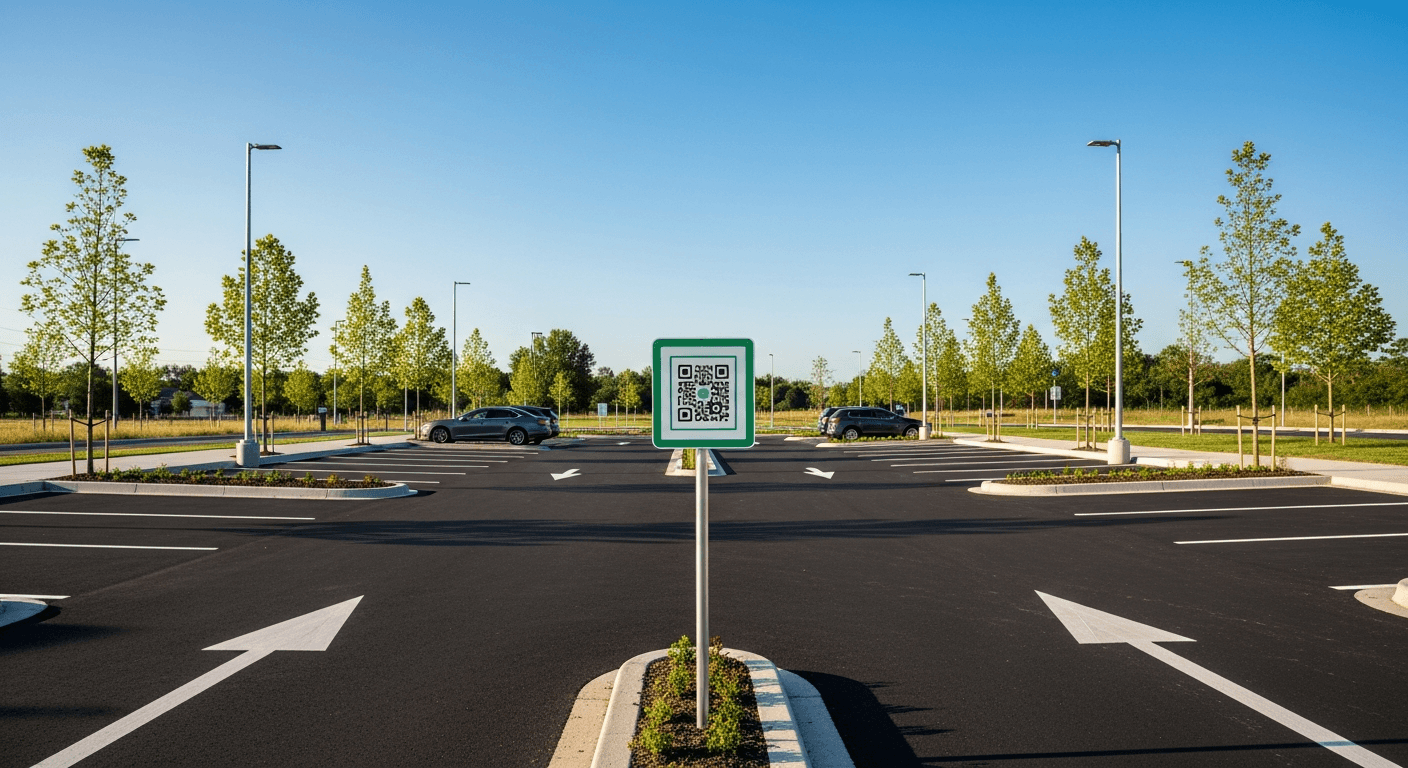
Generate signage for every block within each zone. Print-on-demand, posts on existing meter or street-light poles.
Bulk-import existing permit holders via CSV. Permits link to licence plate and remain valid by date range.
Each officer downloads Park Graph Enforcement on their issued phone. Officer ID maps to badge number for audit trail.
Park Graph integrates with TIPS, Gtechna, or your existing court-clerk system to write violations as citations.
Run a single zone for 2 weeks. Compare paid sessions vs. ANPR or audit counts. Iterate signage and rates.
Most municipal parking deployments are live within a day. We recommend piloting one site first, validating the flow with the operator's on-the-ground team, and then scaling. Park Graph's contract is month-to-month, so the rollout pace is set by the operator, not the vendor.
Replace 60 pay-and-display kiosks with QR signage on every block. Pilot 2 zones first, scale to all 12. Enforcement officers issue citations from their issued iPhones.
Pay-by-plate
City issues 4,000 residential permits via Park Graph. Permit holders pay $35/year; visitors pay an hourly rate within the same zone. One reconciliation pipeline.
Permit + transient
Tourism town runs default rates 9 months a year and surges to a higher rate Memorial Day through Labor Day. Surge windows pre-staged in dashboard.
Seasonal surge
City and university coordinate on a shared zone. Park Graph configures different rates for university affiliates (validated via SSO) vs. general public.
SSO validation
Loading zones get a 30-minute free window with QR-based overstay enforcement. Trucks that exceed 30 minutes are auto-billed.
Hardware-free enforcement
Public-works director taps Snow Emergency in the dashboard; all on-street parking is suspended, refunds auto-issued for active sessions, signage updates in seconds.
Emergency operations

| Capability | Park Graph | Legacy parking platform | DIY / hardware-based |
|---|---|---|---|
| On-street kiosk hardware | None — printed QR signs | Required, $8k-$25k/kiosk | Required |
| Driver app required | No — mobile browser | Often vendor app | Often vendor app |
| Residential permit + transient unified | One ledger | Two systems | Two systems |
| Enforcement officer device | Officer's phone | $1,200 vendor terminal | Vendor terminal |
| ADA-compliant signage | Built in | Vendor-dependent | Operator must source |
| Take rate | 3.3-10% (tier-dependent) | 8-15% + monthly + per-zone fee | Card-processor fees only |
| Setup time per zone | <1 day | 4-12 weeks | Months |
| Citation writing API | Open — TIPS, Gtechna, custom | Vendor-locked | Custom development |

The legacy column generalises the experience of working with a vertical-specific legacy vendor. Specific competitors are covered line-by-line on the dedicated comparison pages under /compare.
The map below shows the metro markets and corridors Park Graph is targeting for municipal parking growth in 2026 and beyond. Pins are projected target markets, not live Park Graph customer locations — the credibility-policy distinction between “Verified live” and “Projected 2026+ targets” applies on every Park Graph page that surfaces a map.
Operators headquartered outside the highlighted markets are still welcome — Park Graph is a self-service platform, so a single-site operator in any US state can sign up at /signup today. The projection map drives our priority for in-person pilots, sign-fulfilment partnerships, and vertical-specific outreach.

Visitors increasingly start parking research with an AI agent — "where can I park near city hall on Tuesday afternoon". Park Graph publishes city parking inventory, rates, and time-of-day rules to ChatGPT, Perplexity, Gemini, Grok, and Microsoft Copilot so visitors get real answers from real data, not a stale third-party scrape.
Cities can opt out of AI-agent visibility per zone if there's a policy reason. Most cities opt in: more accurate visitor information reduces the volume of "is there parking near X" calls to the city's information line and improves visitor experience.
Driver: 'Can I park overnight in Zone 7?'
Park Graph: 'Zone 7 is 7am-10pm only. Closest overnight zone is Zone 9 (Main + 6th, $1.50/hr 10pm-7am). Reply MAP for directions.'
Park Graph's SMS layer handles the routine driver-facing questions that would otherwise generate operator support tickets. The exchange above is a real example from the municipal parking vertical; AI handles roughly 90% of these conversations end-to-end with no human escalation.

Why municipal parking operators switch
Replaced by $5 printed QR signs
Officers use issued phones
Of gross at Enterprise rate
Numbers are typical first-year deltas reported by Park Graph operators in this vertical relative to their previous platform.
The economics behind Park Graph in this vertical are simple to model. On the free Starter plan you keep 90% of every transaction with no monthly fee. On Pro at $499/month you keep 95% of every transaction. On Enterprise you keep 96.7%. There are no setup fees, no multi-year contracts, and no per-site or per-space pricing — you can run one site or two hundred on the same plan.
The calculator below estimates monthly take-home revenue across Starter, Pro, and Enterprise plans for any site size, hourly rate, occupancy, and operating-hour configuration you choose. Numbers update live as you adjust the inputs.
0%
Take-home rate (Enterprise)
0 day
Typical site setup
$0
Hardware required
0
AI agent platforms supported
Projected targets reflect 2026+ planning and internal pilot modeling — not live customer outcomes.
See how much you could earn with Park Graph.
Projected monthly revenue
$86,400
Starter
Platform cost
$8,640/mo
Your net revenue
$77,760/mo
Pro
Best valuePlatform cost
$4,819/mo
Your net revenue
$81,581/mo
Enterprise
Platform cost
$5,350/mo
Your net revenue
$81,050/mo

PCI DSS Level 1
Card data tokenized by Stripe; Park Graph never sees raw card numbers.
Aligned with SOC 2 controls
Audit window opens Q3 2026. Annual reports available under NDA on request.
Encrypted at rest + in transit
AES-256 at rest, TLS 1.3 in transit, KMS-managed keys.
Vertical-specific data handling
Federal ADA compliance: every Park Graph QR sign ships with the legally-required font sizes, contrast ratios, and tactile braille options. The mobile payment page meets WCAG 2.1 AA and is audited annually. Procurement docs (HECVAT, GSA-friendly contracts, sample MSA) available on request from /resources/contact.
Free forever on Starter. No credit card to begin. Cancel any time.
Pricing, event surge curves, and on-site context for municipal parking vary by metro. The pages below are the city-specific playbooks — same Park Graph platform, tuned to the local rate baseline and demand calendar.
The installation
No gate to wire. No meter to bolt down. No technician to schedule. Watch an owner take a lot live in four steps — the last one is a real code, mounted on a real post.
 1
1Enter your lot name, spaces, and rate. Park Graph mints a branded QR code that links straight to your payment page.
 2
2Send it to any standard printer. Laminate the sheet for weather protection — that is your entire hardware bill.
 3
3Mount it on a post at the entrance and any major pedestrian path. No gates, no wiring, no installer visit.
 4
4Drivers scan and pay; revenue lands in your dashboard in real time and in your bank within two business days.