Read your analytics dashboard
What you'll do
Learn what each number means, and use it to set better prices.
Have ready
- A live lot. The numbers fill in as drivers pay.
Step 1: Open Analytics and pick dates
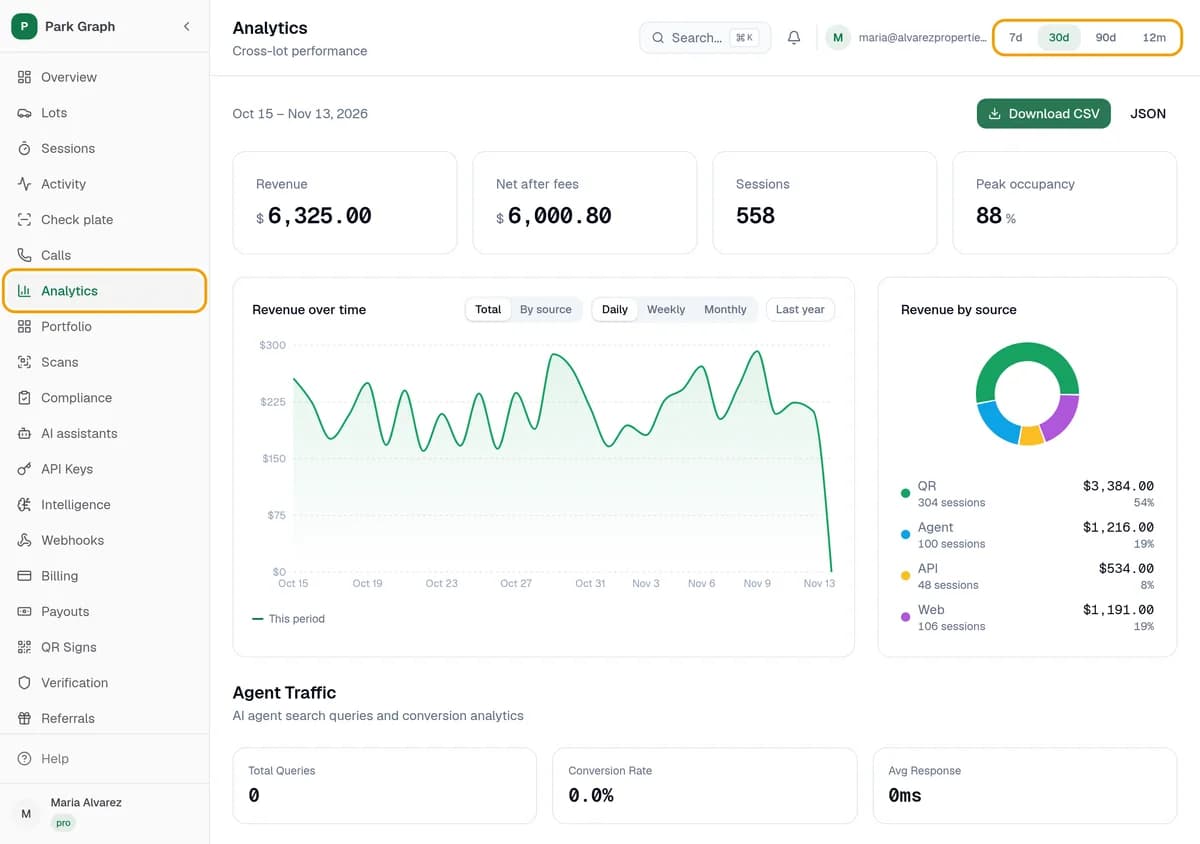
In your dashboard, click Analytics. Pick a date range at the top: 7d, 30d, 90d or 12m. Starter shows the last 30 days; the longer ranges come with Pro.
Step 2: Read the numbers
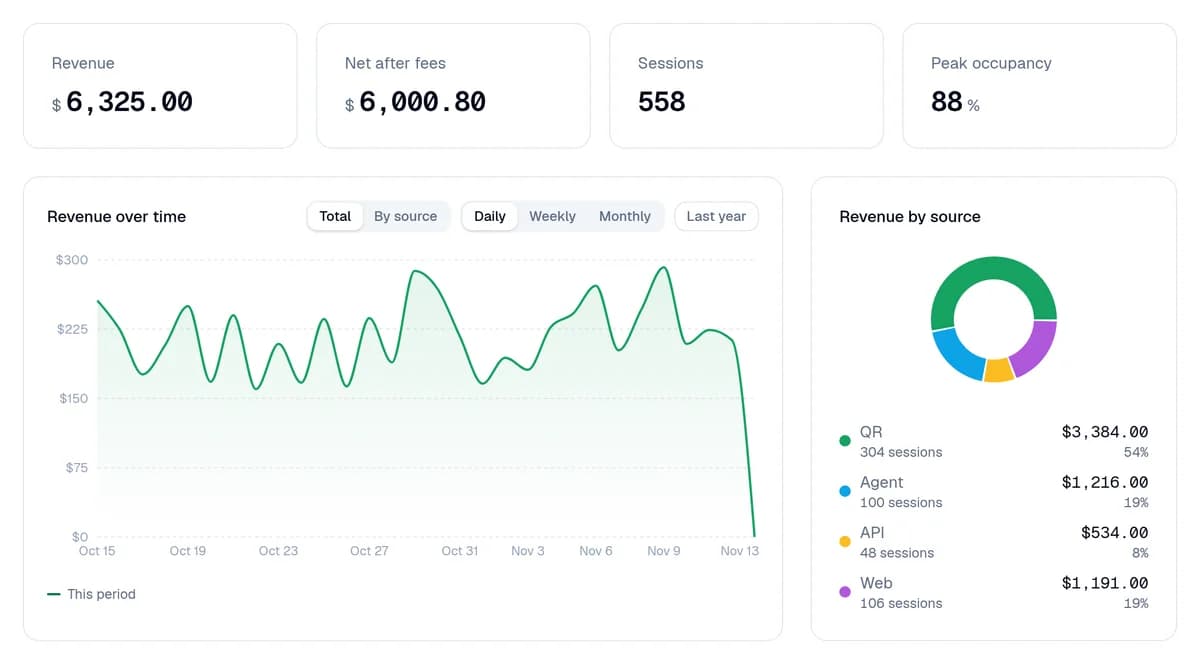
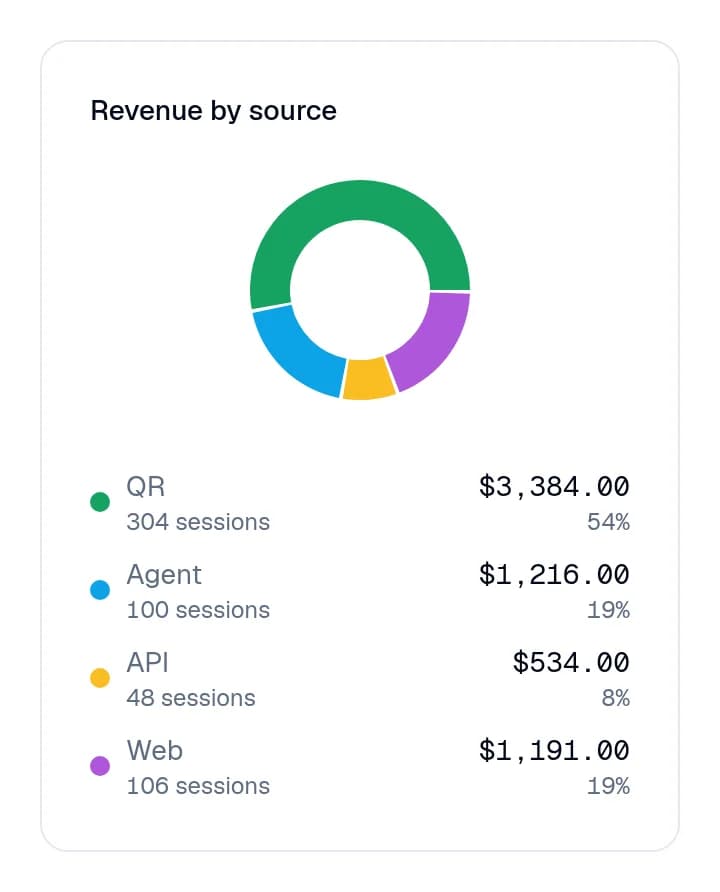
Revenue is what drivers paid. Net after fees is what you keep. Sessions is how many times a driver paid to park. Peak occupancy is how full your lot got. Revenue by source shows how drivers paid: QR is your sign, Agent is AI assistants, plus API and Web.
Step 3: Act on it
Full at busy times? Raise your rate, or turn on surge pricing. Empty a lot of the time? Try a lower rate or a daily max, or sell Monthly passes to people who park every day. Change prices in Lots, your lot, Pricing.
You're done when
You can say what you earned, how many drivers paid, and how full your lot got.
Stuck?
- All zeros? Numbers show up after drivers pay. Check that your lot is live and your sign is posted where drivers see it.
- Can't pick 90d or 12m? Longer ranges come with Pro.
- Want one lot only? Click Lots, click your lot, then click Analytics.
Still stuck? Call (877) 422-PARK.